What it is
Running a globally distributed computing system produces a flood of operational data: every job, every file transfer, every network measurement, every cache hit and every alarm. Most of it is written once and read never. The Operations Analytics Platform keeps the part that matters. Since 2016 the Lab has operated, for ATLAS Distributed Computing and for the facilities we run, an Elasticsearch and Kibana platform that indexes a carefully chosen subset of the most useful operational data from sources as different as the CERN Oracle database, Hadoop, HTCondor and perfSONAR, and makes it searchable in one place for years.
Today it holds 111 billion documents in more than 5,000 indices. It serves the ATLAS computing coordinators, the operators of the Analysis Facility, the WLCG network monitoring effort and the shifters who watch the system around the clock. Increasingly it serves software too: the Lab’s AEGIS operations agents and the Analysis Facility assistant answer questions by querying these indices, and the platform is where anomaly detection across the whole system runs.
What it indexes
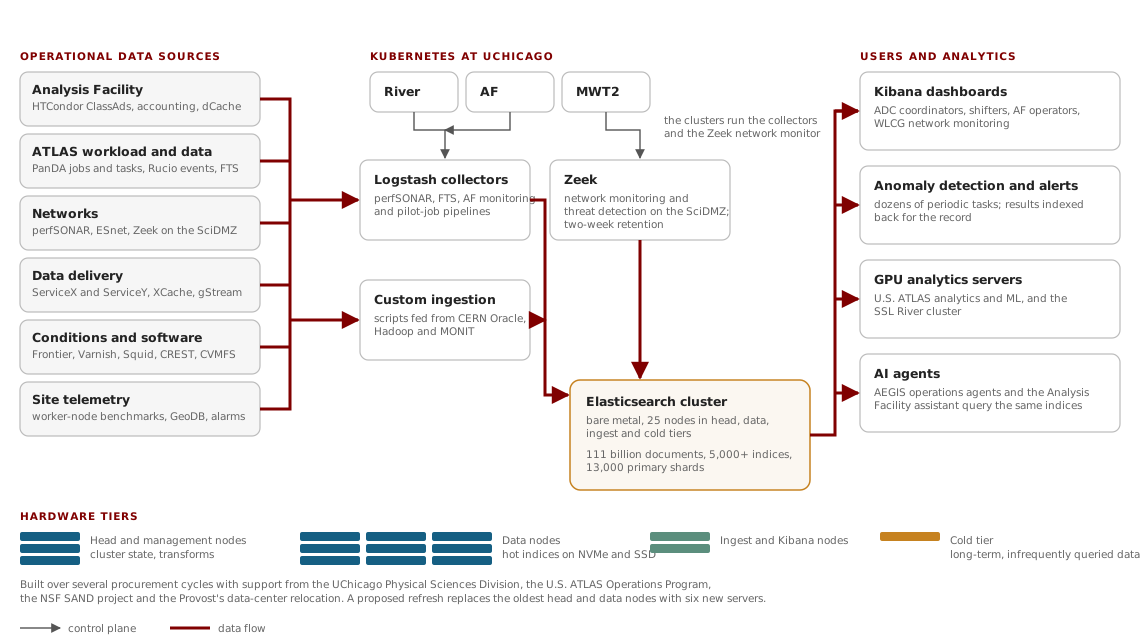
- ATLAS workload. PanDA jobs, tasks and task parameters, updated from CERN Oracle every fifteen minutes. This feeds dozens of dashboards and the investigations that need several sources at once, such as which tasks drive load on the conditions servers.
- Data management. Rucio daemon event logs, and FTS transfer records ingested in real time from the CERN message queue.
- Networks. The only complete long-term archive of perfSONAR data worldwide: bandwidth, packet loss, traceroutes and one-way delays from seven streams sent directly by perfSONAR servers everywhere. This is the basis for network anomaly detection. Zeek monitors the UChicago Science DMZ at high volume and short retention.
- The Analysis Facilities. Monitoring and accounting from all three U.S. ATLAS analysis facilities, plus every HTCondor ClassAd from UChicago, used for utilization studies and by the Analysis Facility assistant.
- Conditions and software delivery. The whole conditions chain, Frontier, Squid, Varnish and CREST, monitored before, during and after the migration to regional Varnish caches, which the Lab led.
- Data delivery and site health. XCache tests, gStream monitoring, worker-node benchmarks collected by pilot jobs, the ATLAS geometry database rebuilds, and the output of the alarm and alert system itself, indexed back for the record.
How it is built
The cluster is bare metal: twenty-five servers in head, data, ingest and cold tiers, assembled over several procurement cycles with support from the UChicago Physical Sciences Division, the U.S. ATLAS Operations Program, the NSF SAND project and the Provost’s data-center relocation. Logstash collectors and custom ingestion scripts run on the Lab’s Kubernetes clusters, River, the Analysis Facility and MWT2, so the ingestion layer scales and recovers independently of the storage. Kibana is the front door for people; GPU analytics servers and the SSL River cluster draw on the same indices for machine learning and research.
Where it is going
The platform is approaching the capacity of its oldest hardware at the same time as demand is rising, because agents ask far more questions than people do. A refresh has been proposed that replaces the oldest head nodes and the nine oldest and smallest data nodes with six new servers, three head and three data, on current-generation CPUs with large memory and NVMe storage. Uniform hardware simplifies operations and makes monitoring signals easier to read, and the design targets the three places Elasticsearch shows stress under load: query concurrency, cache and heap headroom, and storage latency during merges and recovery. Running the same platform in a commercial cloud would cost many times more. The plan is sized to carry the platform through about 2031.
Collaborations and facilities that want to index operational data, build dashboards or run analytics against ATLAS computing data should contact Ilija Vukotic.