Getting in
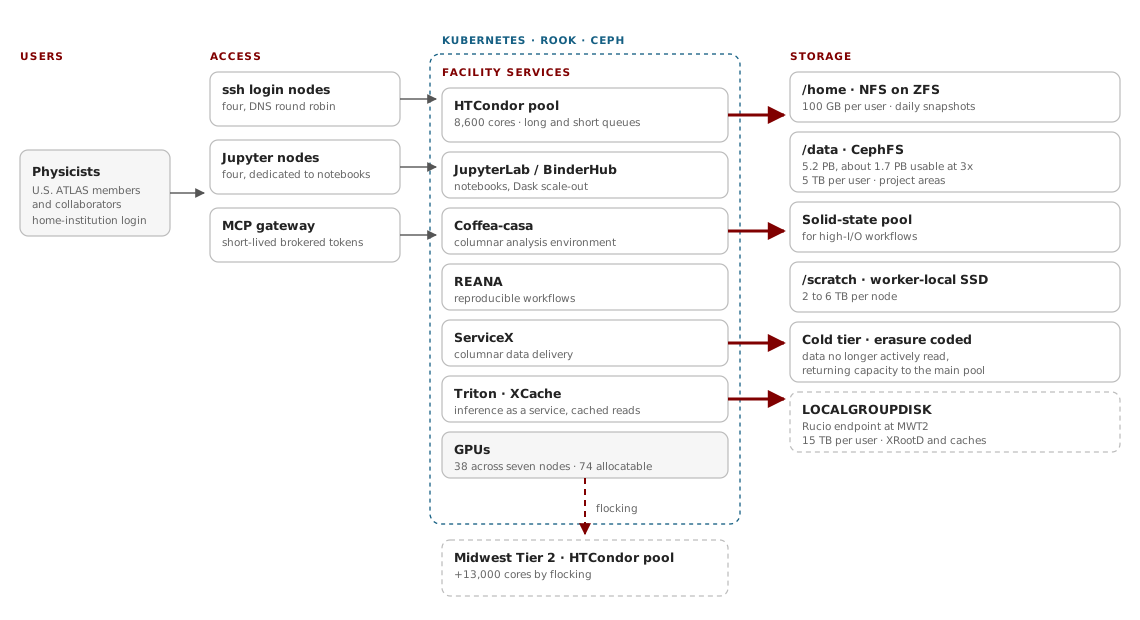
Four login nodes behind a DNS round robin handle interactive sessions and job submission, with four more dedicated to Jupyter notebooks. Access is federated: a physicist signs in with their home institution’s credentials rather than applying for a local account.
From there the facility offers several ways to work, and most people use more than one. A shell, for developing and compiling against software delivered over CVMFS. Notebooks, through JupyterLab and BinderHub, with Dask to scale a session out across the batch pool. Coffea-casa, a preconfigured columnar analysis environment. REANA, for workflows that have to be reproducible later. And increasingly an agentic route, where an LLM client reaches facility services through a credential-brokered gateway that mints short-lived, per-service tokens rather than handing an agent a user’s credentials.
Over the past year the facility served about 458 batch users and 757 interactive users, with roughly 90 people on it in a typical day.
Compute
Local batch is HTCondor, about 8,600 cores shared across batch submission, notebook sessions and the services that support them. When that is not enough, jobs flock to the Midwest Tier 2 Center’s Chicago compute cluster, adding roughly 13,000 more cores. The two facilities share a data center and a network, so the boundary between them is close to invisible from a user’s perspective.
The GPU pool spans several NVIDIA generations across seven nodes: an H200, four A100s, four V100s and two dozen RTX cards. Partitioning matters more than the raw count — the newest cards are sliced finely, so roughly three dozen physical GPUs present as about 74 allocatable devices and many users share a card without contending for it. Most GPU use here happens inside notebooks rather than in batch jobs, the opposite of the pattern at most HPC centres, and that shapes how the capacity is carved up.
Storage, in layers
One storage model does not fit an analysis facility. File sizes range from enormous to tiny, and access patterns from perfectly sequential to entirely random, so the facility offers several tiers and helps users pick between them:
- Home directories sit on an NVMe ZFS server exported over NFS, with a 100 GB quota, daily snapshots and a separate backup server. Deleted files can be recovered on request.
- User data lives on 5.2 PB of Ceph, about 1.7 PB usable at three-way replication, integrated into the Kubernetes cluster with Rook and mounted on every interactive and batch node. The default allocation is 5 TB per user, with a project area for groups working on shared datasets.
- A solid-state pool carries workflows whose input and output patterns would otherwise degrade performance for everyone on spinning disk.
- Local scratch on the worker nodes, a few terabytes each, handles working data that never needs to leave the machine.
- LOCALGROUPDISK, the Rucio storage endpoint at MWT2, holds the datasets too large for the shared filesystem, 15 TB per user by default, reachable through XRootD and local caches.
A cold tier using erasure coding has been introduced for data that is no longer actively read, returning capacity to the primary pool. Migrating the rest of the user data the same way is in progress and will roughly double effective capacity.
The traffic those tiers carry is lopsided in a useful way. Over a recent ninety-day window the shared filesystem absorbed 885 TB of writes and served 16.2 PB of reads; the facility’s caches pulled 197 TB from the grid and delivered more than a petabyte from it; and the columnar delivery service read 468 TB to produce 28 TB of transformed output. Analysis is overwhelmingly a read problem, and caching and pre-transformation are what keep it affordable.
The service stack
Beneath the shell and the notebook sits the stack a data-intensive analysis actually touches, and the quarterly numbers give a sense of the load it carries.
ServiceX delivers columnar data on demand — about 24,000 extraction requests across 166 datasets in a recent quarter, serving 6.9 billion records. Triton provides inference-as-a-service, sustaining roughly 5,500 to 7,000 inferences per second without failures under stress testing. XCache keeps about 2.3 PB served from close to the compute rather than fetched across the wide area. coffea-casa supplies scalable interactive Python, REANA reproducible workflows, and JupyterHub and BinderHub the front doors — all behind one institutional sign-on.
Built on Kubernetes
Everything above the hardware runs on Kubernetes, with Ceph integrated through Rook and the cluster managed declaratively. Identity is handled by Keycloak, giving users one sign-in across the facility’s web services. Batch, notebooks, data delivery, inference-as-a-service and the facility’s own supporting services are all workloads on the same substrate, which is what allows a quarterly update cadence on a facility in constant use.
That choice is the facility’s defining difference from the Tier 2 center beside it. MWT2 is bare metal and changes slowly by design. The Analysis Facility is expected to change, because the analysis methods it serves are still being invented.
The cluster as it runs
A live snapshot gives a better picture of the facility than any architecture diagram: 141 worker nodes carrying 859 deployments across 76 namespaces, with roughly 3,234 pods running at once.
The distribution is instructive. Storage dominates by a wide margin — the Ceph layer alone accounts for the largest share of running pods — followed by reproducible workflows, then the platform’s own networking and monitoring, then batch. The user-facing services everyone thinks of as “the Analysis Facility” — notebooks, data delivery, the agent gateway — are a small fraction of the pod count. Most of what runs here exists to make storage and scheduling work reliably, which is usually where the real effort in a facility goes.
What it has been used to prove
The facility doubles as the proving ground for analysis at high-luminosity LHC scale, through a sequence of challenges run with IRIS-HEP, each closer to a real analysis than the last. The 2022–23 Analysis Grand Challenge ran an end-to-end top-pair analysis over 940 million events. The 2024–25 challenge pushed sustained reads past 200 Gbps, processing 32 TB across roughly 1,700 workers. The 2025–26 Integration Challenge ran a full Run-2 plus Run-3 analysis with 350 systematic variations across 765 workers, completing in about twenty minutes.
The open question those results raise is not whether the hardware can do it. It is adoption: the services behind those numbers are available to every user, and getting people onto them is the harder problem.
The other U.S. ATLAS analysis facilities
UChicago is one of three analysis facilities serving U.S. ATLAS, alongside Brookhaven National Laboratory, whose facility is built on the lab’s Scientific Computing and Data Facility and shared with DUNE, Belle II and FCC, and SLAC, whose facility runs on the Shared Science Data Facility with a Slurm batch system and a parallel filesystem.
The three have converged on a similar set of services: shell access, notebooks with scale-out, batch, and a common analysis software stack from CVMFS. They still differ in the details that matter when someone moves between them, including identity and account creation, storage quotas and capabilities, batch system and supported software environments. Reducing that friction, so an analysis written at one facility runs at another without rework, is an active concern across all three.